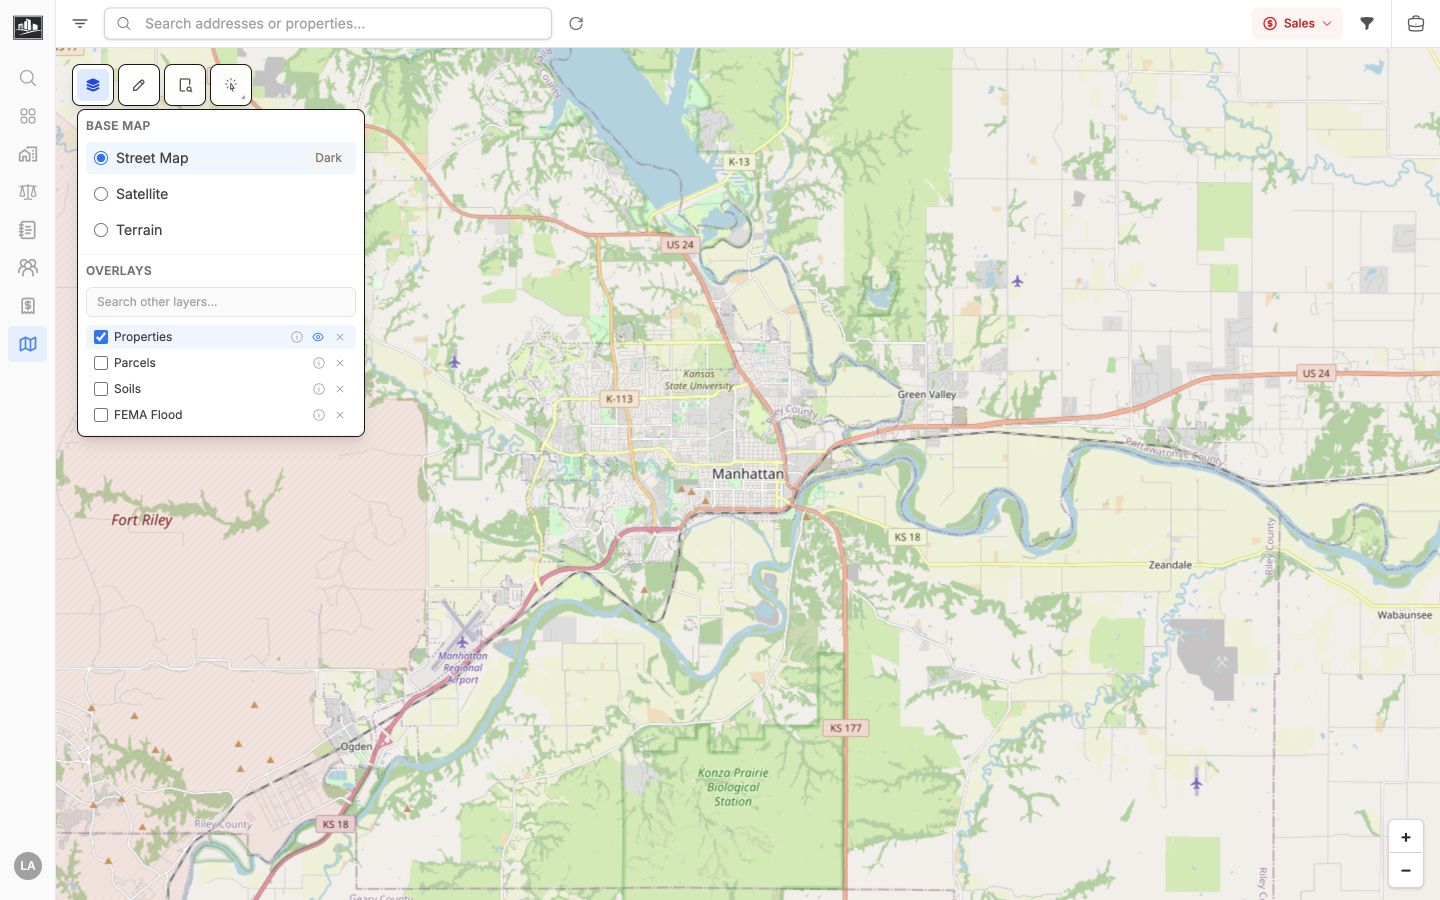
The platform provides a rich set of map overlays sourced from federal agencies, local GIS servers, and internal application data. Overlays are organized into three tiers: built-in data layers that ship with the platform, federal/platform layers curated from government ArcGIS services, and application layers driven by your organization’s data.
Use the layer catalog to choose a base map, enable built-in overlays, and search
for additional platform layers. The information button beside a layer opens its
source and availability details.
These layers are always available and can be toggled from the layer switcher. They load data dynamically based on the current map viewport.
Property
Value
Rendering Vector polygons (ArcGIS REST, bbox strategy)
Source Local county GIS servers (cascading provider with fallback)
Max Features 2,500 per extent (LRU eviction to 1,500)
Extent TTL 10 minutes
Fields returned:
Field
Description
OBJECTIDArcGIS object identifier
PIDParcel identification number
QuickRefIDQuick reference identifier
Geometry
Parcel polygon boundary
Styling: Blue outline with light fill. Selected parcels use a darker blue fill with thicker stroke. Hover state shows orange outline.
Property
Value
Rendering Vector polygons (ArcGIS REST, bbox strategy)
Source FEMA National Flood Hazard Layer (NFHL)
Provider Federal Emergency Management Agency (FEMA)
Max Features 2,000
Geometry Resolution ~1 meter (maxAllowableOffset=0.00001)
Zoom Range 10 - 20
Fields returned:
Field
Description
FLD_ZONEFlood zone classification (A, AE, AH, AO, AR, A99, D, X, V, VE)
ZONE_SUBTYZone subtype (0.2 PCT, 1 PCT DRAINAGE, FLOODWAY, FUTURE, REDUCED, LEVEE)
DFIRM_IDDigital Flood Insurance Rate Map identifier
FLD_AR_IDFlood area identifier
Geometry
Flood zone polygon boundary
Zone styling (official FEMA colors):
Zone
Color
Risk Level
Regulatory Floodway
Red
Highest risk — regulatory floodway
Zone A / AE / AH / AO / AR / A99
Cyan
1% annual chance flood (100-year)
Zone V / VE
Dark Blue
Coastal high hazard
Zone X (0.2%)
Orange
0.2% annual chance (500-year)
Zone X (Future/Levee)
Gray
Reduced risk behind levee
Zone D
Yellow
Undetermined hazard
Zone X (Unshaded)
Light Gray
Minimal flood risk
Filter: Minimal-risk zones (Zone X unshaded) are excluded by default to reduce noise.
Soils data is available in two forms: a map layer showing soil polygons and a tabular analysis with detailed soil properties for a specific area.
Property
Value
Rendering Vector polygons (OGC WFS 1.0.0, bbox strategy)
Source USDA NRCS Soil Data Mart WFS
Provider USDA Natural Resources Conservation Service
Feature Type mapunitpolyextended
Response Format GML2 (parsed to GeoJSON client-side)
Max Features 500
Fields returned:
Field
Description
musymMap unit symbol
munameMap unit / soil series name
mukeyMap unit key (unique identifier)
drclassdcdDominant drainage class
hydgrpdcdHydrologic group
slopegradwtaWeighted average slope gradient
flodfreqdcdDominant flooding frequency
aws050wtaAvailable water storage (0-50cm)
Geometry
Soil polygon boundary
Styling: Color-coded by drainage class on a green-to-red spectrum (well drained = green, poorly drained = red).
Property
Value
Rendering Table in Soils panel tab
Source USDA SDM Tabular REST
Query Type T-SQL with WKT polygon geometry
Fields returned:
Field
Description
mukeyMap unit key
munameSoil series name
farmlandClassClassification (e.g., “Prime farmland”, “Farmland of statewide importance”)
acresAcres within the query polygon
percentagePercentage of total area
capabilityClassLand capability class (I - VIII)
drainageClassDrainage classification
nccpiValueNational Commodity Crop Productivity Index (0 - 1)
Fields returned:
Field
Description
FULLCODEFull land use classification code
LUCODELand use code
ADVERSEAdverse influence indicator
FACTORAdjustment factor
CRPEXPYRCRP contract expiration year
Shape_AreaPolygon area
Geometry
Land use polygon boundary
Land use code styling:
Code
Land Use
Color
1100Primary Site
Red
2100Dry Land Crop
Light Yellow
2CRP100Conservation Reserve Program (CRP)
Gold
3100Residual
Purple
3F100Flood Irrigated
Cyan
3S100Sprinkler Irrigated
Turquoise
4100Tame Grass
Light Green
4RB100Riparian Buffer
Dark Green
5100Native Grass
Green
6100Sand Pit
Brown
7100Rock Quarry
Dark Brown
W100Wasteland
Gray
Property
Value
Rendering Raster WMS tiles
Source USDA NASS CropScape WMS
Provider USDA National Agricultural Statistics Service
Resolution 30 meters per pixel
Projection EPSG:4326 (WGS84)
Update Frequency Annual
Tile Format PNG with transparency
Opacity 70%
CropScape provides per-pixel crop type classification across the continental US. The raster layer renders as a WMS overlay, while tabular statistics are available in the CropScape panel tab.
Tabular query endpoint: https://nassgeodata.gmu.edu/axis2/services/CDLService/GetCDLStat
Coordinates are projected to Albers Equal Area Conic (EPSG:5070) before querying. The response is CSV format with columns: Category, CDL Value, Pixel Count, Acreage.
Common crop codes:
CDL Value
Crop Type
Color
1
Corn
Yellow
5
Soybeans
Dark Green
24
Winter Wheat
Tan
36
Alfalfa
Gold
37
Other Hay/Non-Alfalfa
Light Green
176
Grassland/Pasture
Tan
141 - 143
Forest Types
Green
121 - 124
Developed / Urban
Gray - Red
83
Water
Dark Blue
87
Wetlands
Light Blue
The platform includes 60+ curated federal government layers stored in the database and rendered dynamically. These layers are sourced from public ArcGIS REST services operated by federal agencies. Up to 10 can be enabled simultaneously.
Layers are rendered based on their type:
ArcGIS MapServer — Raster tiles via TileArcGISRestArcGIS FeatureServer — Vector features via EsriJSON queriesWMS — OGC Web Map Service raster tilesMVT — Mapbox Vector Tiles
Layer
Source
Type
Description
FEMA National Flood Hazard Layer (NFHL) FEMA MapServer ArcGIS MapServer
Official digital flood hazard data — Special Flood Hazard Areas, flood zones, floodways, and base flood elevations
Layer
Source
Type
Description
EPA Cleanup Sites EPA FeatureServer ArcGIS FeatureServer
Superfund, RCRA corrective action, and brownfield cleanup sites
EPA Brownfield Grant Jurisdictions EPA FeatureServer ArcGIS FeatureServer
Areas receiving Brownfield Assessment, Cleanup, and Revolving Loan Fund grants
EPA RCRA Hazardous Waste Facilities EPA FeatureServer ArcGIS FeatureServer
Facilities regulated under RCRA for hazardous waste management
EPA NPDES Major Dischargers EPA FeatureServer ArcGIS FeatureServer
Major facilities with NPDES water discharge permits
EPA Superfund Site Boundaries EPA FeatureServer ArcGIS FeatureServer
National Priorities List (NPL) Superfund site boundaries
EPA Underground Storage Tanks EPA FeatureServer ArcGIS FeatureServer
Active or closed underground storage tanks regulated under RCRA Subtitle I
Layer
Source
Type
Description
NOAA Tornado Damage Points NOAA FeatureServer ArcGIS FeatureServer
Post-storm damage assessment points from NWS tornado damage surveys
NOAA Tornado Damage Paths NOAA FeatureServer ArcGIS FeatureServer
Tornado damage path polygons from NWS damage assessment toolkit
Over 30 layers from the USFS Enterprise Data Warehouse , all rendered as ArcGIS MapServer raster tiles.
Layer
Service
Description
USFS Surface Ownership EDW/EDW_SurfaceOwnership_01Federal, state, local, and private land ownership parcels
USFS Basic Ownership EDW/EDW_BasicOwnership_01Simplified NFS land ownership boundaries
NFS Boundaries EDW/EDW_ForestSystemBoundaries_01Administrative boundaries of National Forests, Grasslands, and NFS units
Proclaimed Forest Boundaries EDW/EDW_ProclaimedForestBoundaries_01Boundaries established by Presidential proclamation or act of Congress
Ranger Districts EDW/EDW_RangerDistricts_01Administrative Ranger District boundaries
National Grasslands EDW/EDW_NationalGrassland_01National Grassland boundaries
Tribal Indian Lands EDW/EDW_TribalIndianLands_01Tribal and Indian land boundaries relative to the NFS
Land Management Planning EDW/EDW_LandManagementPlanning_01Forest plan management area boundaries and designations
Layer
Service
Description
Wilderness Areas EDW/EDW_Wilderness_01Congressionally designated Wilderness areas
Wild & Scenic Rivers EDW/EDW_WildScenicRiver_01Designated Wild and Scenic River corridors
Inventoried Roadless Areas (2001) EDW/EDW_InventoriedRoadlessAreas2001_01Roadless areas per the 2001 Roadless Area Conservation Rule
PADUS Protected Areas EDW/EDW_PADUS_01Comprehensive inventory of US protected lands
Watersheds EDW/EDW_Watersheds_01Hydrologic unit boundaries (HUC) and priority watersheds
Fire Occurrence & Perimeters EDW/EDW_FireOccurrenceAndPerimeter_01Historical fire occurrence points and perimeters
MTBS Burn Severity EDW/EDW_MTBS_01Burn severity for all large US fires since 1984
RAVG Burn Severity EDW/EDW_RAVG_v2_01Satellite-derived rapid assessment burn severity
Hazardous Fuels Treatments EDW/EDW_HazardousFuelsTreatments_01Prescribed burns, mechanical treatments, and fuels reduction areas
Burned Area Emergency Response EDW/EDW_BurnedAreaEmergencyResponse_01Post-fire emergency stabilization treatment areas
Fireshed Registry EDW/EDW_FireshedRegistry_01Fireshed boundaries for wildfire risk analysis
Wildland-Urban Interface (2020) EDW/EDW_WUI_2020_01Where human development meets wildland vegetation
Ecomap 2025 EDW/EDW_Ecomap2025_01Ecological classification (domains, divisions, provinces, sections)
Insect & Disease Survey EDW/EDW_InsectandDiseaseSurvey_01Aerial survey data for forest areas impacted by insects/diseases
Special Status Areas EDW/EDW_SpecialStatusArea_01Research Natural Areas, Botanical Areas, Geological Areas
CERCLA Sites EDW/EDW_CERCLASite_01Superfund (CERCLA) sites on or near NFS lands
Forests to Faucets EDW/EDW_ForeststoFaucets_02Importance of forested watersheds for drinking water
Community Wildfire Defense Grants EDW/EDW_CommWildfireDefenseGrant_01Communities receiving wildfire defense grant funding
Layer
Service
Description
Timber Harvest EDW/EDW_TimberHarvest_01Completed timber harvest activity areas on NFS lands
Range Management EDW/EDW_RangeManagement_01Grazing allotment boundaries and range management areas
Silviculture Reforestation EDW/EDW_SilvicultureReforestation_01Reforestation activity areas on NFS lands
Layer
Service
Description
NFS Roads EDW/EDW_RoadBasic_01National Forest road network with road class, surface type, and maintenance level
NFS Trails EDW/EDW_TrailNFSPublish_01Trail network with trail class, use types, and accessibility
Recreation Sites EDW/EDW_InfraRecreationSites_01Campgrounds, picnic areas, trailheads, and other developed sites
Motor Vehicle Use Map EDW/EDW_MVUM_01Roads, trails, and areas designated for motor vehicle use
Right of Way EDW/EDW_RightofWay_01Authorized rights-of-way for roads, utilities, and pipelines
Layer
Service
Description
Mineral Rights EDW/EDW_MineralRights_01Mineral rights and subsurface estate ownership on NFS lands
Layer
Source
Type
Description
USDA Cropland Data Layer (CDL) USDA NASS WMS WMS
National crop-specific land cover classification at 30m resolution. Updated annually.
National Land Cover Database (NLCD) USGS MRLC WMS WMS
16 land cover classes (developed, forest, cropland, wetlands, etc.) at 30m resolution
Layer
Source
Type
Description
Income Markets by Census Tract (FFIEC) FFIEC FeatureServer ArcGIS FeatureServer
Census tract-level median family income relative to MSA/MD median
Layer
Source
Type
Description
USGS Mineral Resources Data System USGS FeatureServer ArcGIS FeatureServer
Mineral resource locations, mines, and prospects
Layer
Source
Type
Description
DOE Regional Clean Hydrogen Hubs DOE/NETL FeatureServer ArcGIS FeatureServer
Regional Clean Hydrogen Hub project locations
These layers display data from your organization’s database.
Property
Value
Rendering Vector markers with animated clustering
Source Internal API (/api/properties)
Loading Viewport-based with LRU eviction
Shows all properties in the current viewport with clustering at lower zoom levels. Individual markers appear at street-level zoom. Supports filtering by:
Show All — All properties in viewportMy Work — Properties from your active assignmentsRecently Viewed — Properties you recently accessed
Property
Value
Rendering Vector markers with type-specific colors
Source Internal API (type-specific endpoints)
Loading Viewport-based with pagination
Four comparable types, each with distinct styling:
Type
Endpoint
Color
Sales
/api/salesRed / Burgundy
Leases
/api/leasesGreen
Income & Expense
/api/income-expensePurple
Cost
/api/costOrange
Comparables are gated by the Properties layer — they only display when the Properties overlay is enabled.
Property
Value
Rendering Vector polygon (GeoJSON)
Source boundary column from the properties table
Styling Blue stroke (#3b82f6), 3px width, 15% fill opacity
Displays the saved parcel boundary for the current subject property on detail and form map views.
User-drawn geometry layers for marking up the map:
Annotations — Lines, polygons, rectangles, circles, and text markers with customizable colors, stroke widths, and fill opacity. Can be persisted to the database.Measurements — Distance (line segments) and area (polygon) measurements with configurable units (miles, feet, km, meters). Session-only.
When generating static maps for reports, the system renders a subset of overlays as composited raster images:
Layer
Export Support
Method
Parcels
Yes
ArcGIS REST vector fetch
FEMA Flood Zones
Yes
ArcGIS REST vector fetch with zone styling
Agricultural Land
Yes
ArcGIS REST vector fetch
Soils
No
Tabular data only (no raster export)
Federal Layers (ArcGIS)
Yes
MapServer/FeatureServer export endpoint
Federal Layers (WMS)
Yes
WMS GetMap request
Overlays are composited onto the base map using the Sharp image processing library.
Platform layers are managed through the Map Layers API:
GET /api/map-layers?limit=50&isPlatform=true
Query parameters:
Parameter
Type
Description
limitnumber
Max results (default 50, max 400)
searchstring
Filter by title, description, category, or provider
isPlatformboolean
Filter to platform-curated layers
categorystring
Filter by category
Response fields per layer:
Field
Description
idUUID
nameUnique identifier (e.g., fema:nfhl-national)
titleDisplay name
descriptionMarkdown description
layerTypeARCGIS_MAPSERVER, WMS, MVT, WFS, VECTOR, RASTER
categoryGrouping category
sourceProviderProvider name (EPA, FEMA, USGS, etc.)
sourceUrlPrimary ArcGIS REST endpoint
externalTileUrlTile rendering URL
externalLayerIdWMS layer name (for WMS type)
minZoom / maxZoomZoom level constraints
styleCustom styling configuration (JSON)
geometryTypePoint, LineString, Polygon, etc.